
Smart Home Energy Management System
A platform of connected devices and services that cuts household energy use while keeping occupants comfortable, through usage analytics and automation. It builds on our appliance-level data from real Indian homes, and on models that generate realistic data where none exists.
- Monitoring
- Smart meters, smart sockets, temperature and humidity sensors
- Runs on
- Cloud or edge, so it works with or without continuous internet
- Assistant
- LLM insights, chat-based control and WhatsApp nudges
How the system works
Smart meters, smart sockets and room sensors in the home connect to a central service. The service can run in the cloud or on the edge, on a small computer inside the home, so the system keeps working with or without continuous internet.
- Smart meters and smart sockets measure what each part of the home uses, and send readings over MQTT.
- An MQTT broker collects the readings from every device.
- An API service stores them in a NoSQL database and works out the usage analytics.
- Occupants see their home on a phone or computer, and can switch appliances from there.
An assistant that speaks plainly
An LLM layer turns meter and sensor data into plain-language insights. Occupants can ask about their home's energy use, and control it, simply by chatting.
A WhatsApp-based nudging system, developed and tested by our students, uses the same LLM to send timely, personalised prompts that help families shift or reduce their consumption.
Appliance-level electricity use in a home
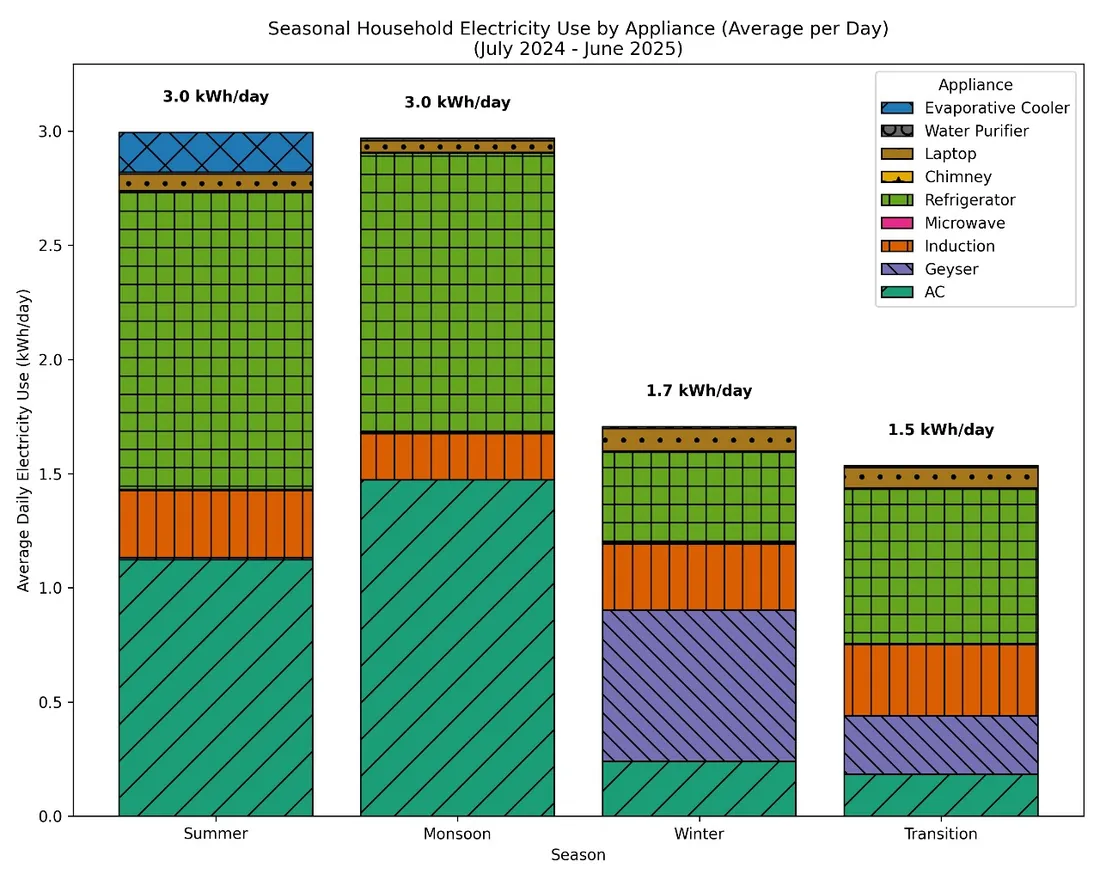
We followed one household in Mohali for 12 months, from July 2024 to June 2025, using smart plugs, a smart meter and indoor temperature and humidity sensors. The air conditioner, geyser, induction cooktop and refrigerator accounted for most of the electricity used.
Usage tracked the weather closely: the air conditioner ran in hot and humid conditions, the geyser in cold weather and the evaporative cooler in hot and dry weather. Daily peaks followed bathing and cooking routines, sharper on weekdays and more flexible at weekends. Indoor conditions stayed mostly within India-specific adaptive comfort limits, showing that season-aware, manual control of appliances, without any automation, can keep energy use low without giving up comfort.
Simulating household electricity use
High-resolution data on household electricity use is scarce in India. Our Residential Electricity Usage Simulation (REUS) approach generates realistic synthetic datasets. It learns from a year of hourly data from 65 households across seven residential categories, with 18 socio-technical features per home.
We combined probabilistic finite state modelling, feature selection and machine learning, and benchmarked LSTM and Transformer models against Markov chains and ARIMA. Bidirectional LSTM models captured household patterns best, with the lowest prediction errors. Region-specific synthetic data can support energy research, planning and policy without costly and intrusive data collection.
Earlier findings
- In 20 households in Hyderabad, air conditioners, geysers, refrigerators and washing machines used about 60% of daily electricity.
- A survey of 425 residents of Mumbai found high willingness to adopt smart home technology. More than 40% named security as their top priority, and data privacy was the biggest concern.
More in decarbonizing the building sector
Decarbonizing the building sector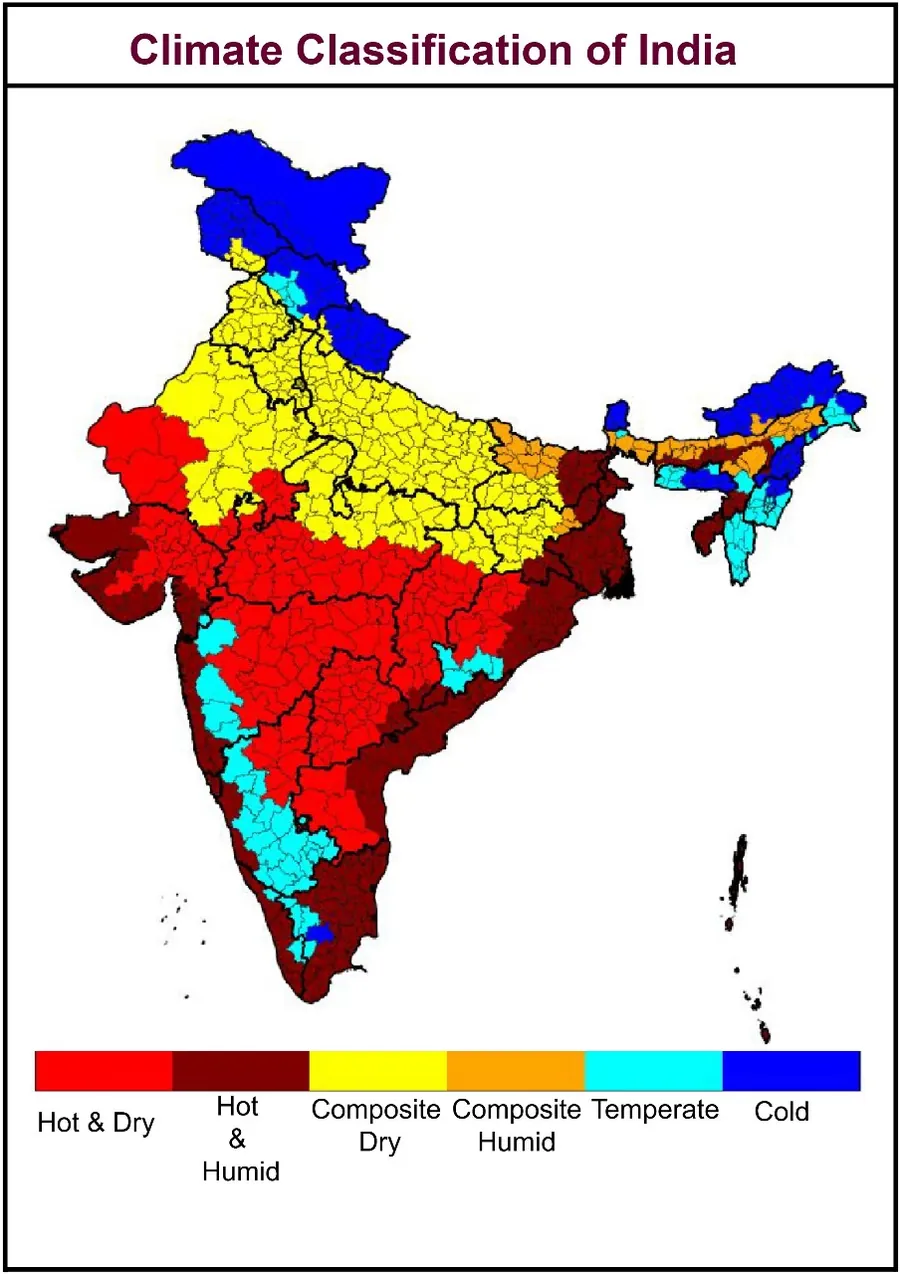
Climate zones for Indian districts
A new climate classification for every district in India, built for building energy performance.
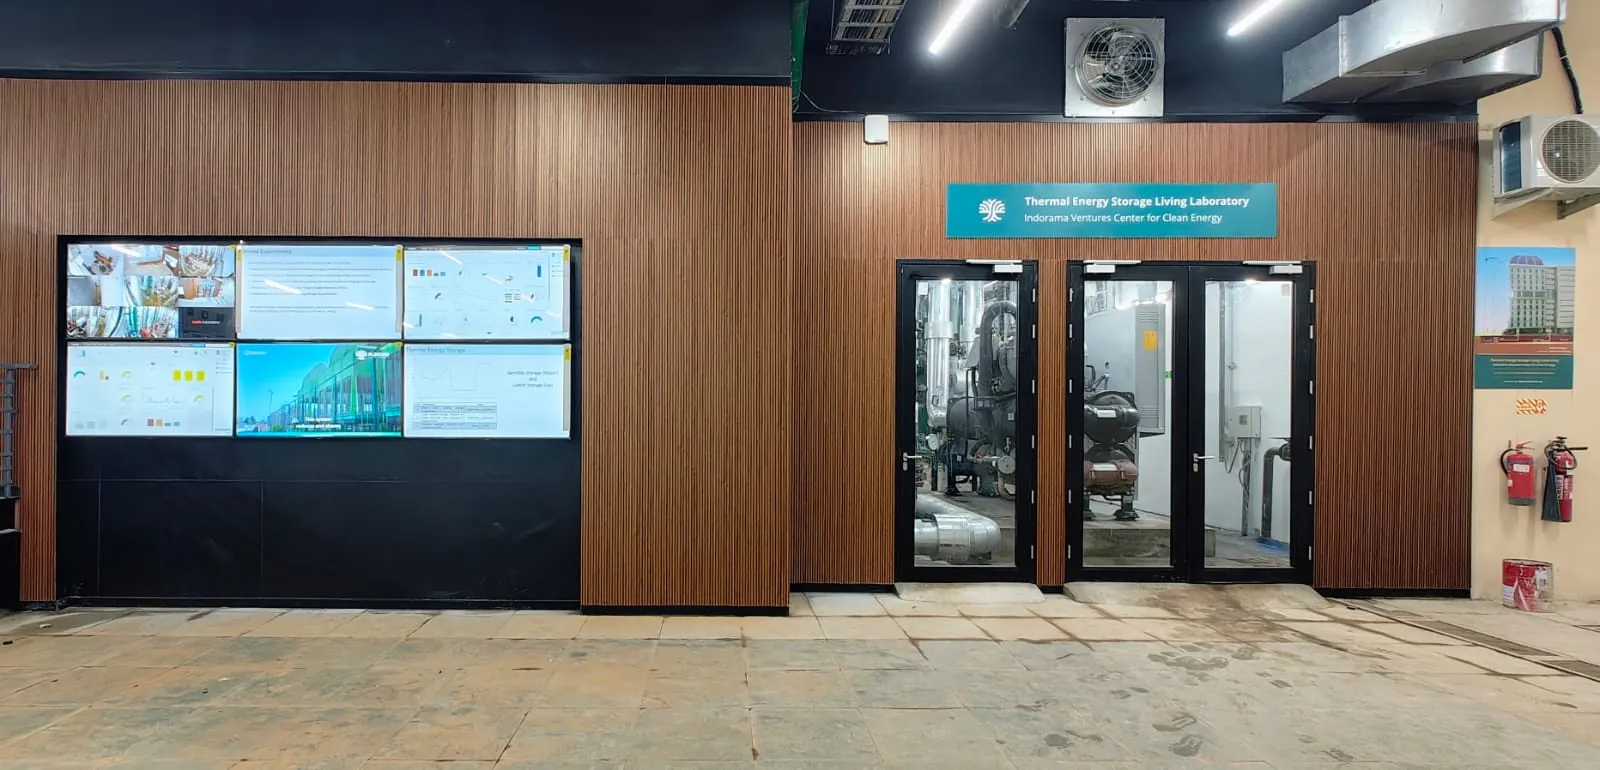
Thermal Energy Storage Living Lab
India's largest academic research testbed for thermal storage, cooling a 220-room hostel at night with energy stored by day.
District cooling for homes
Operational data from 387 homes in Hyderabad shows district cooling can cut installed cooling capacity by up to 90%.